Grafana
| Plugin details | |
|---|---|
| Created by | K-Phoen |
| Category | Monitoring |
| Source | GitHub |
| Type | Open-source plugin |
Configuration
Application configuration YAML
This plugin requires a backend proxy configuration to make calls to Grafana with authentication.
In the following configuration, replace <grafana-url> with the Grafana instance (for example https://grafana.mycompany.com) and similarly replace public domain as well.
Make sure that the slash / is not added at the end.
If unified alerting is enabled in Grafana, then mark unifiedAlerting as true
proxy:
  /grafana/api:
    target: https://<grafana-url>
    pathRewrite:
      api/proxy/grafana/api/?: /
    headers:
      Authorization: Bearer ${GRAFANA_TOKEN}
grafana:
  domain: https://<grafana-monitoring-url>
  unifiedAlerting: false
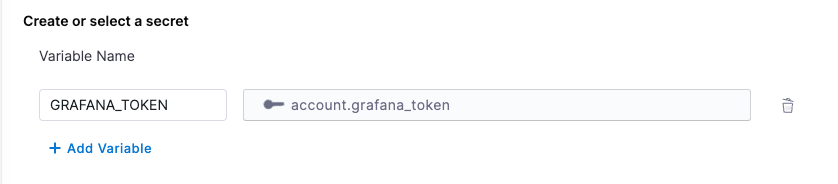
Secrets
Since the GRAFANA_TOKEN variable is used in the application configuration, you must generate a Grafana API key and set it as the value of GRAFANA_TOKEN. For instructions on how to create a Grafana API key, read the instructions.
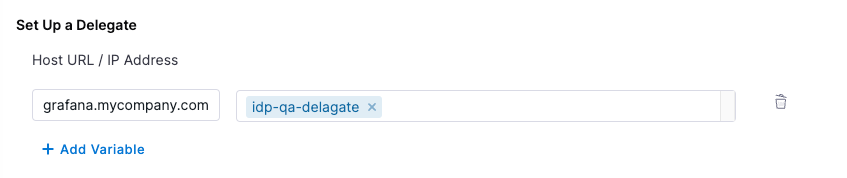
Delegate proxy
If your Grafana instance is hosted on a public cloud and can be accessed directly using a token, skip this section.
If your Grafana instance is self-hosted or has an IP address allowlist, include the base URL grafana.mycompany.com in the delegate proxy section.
When adding the host, include only the host name. Remove the protocol (HTTP/HTTPS) associated with it.
Layout
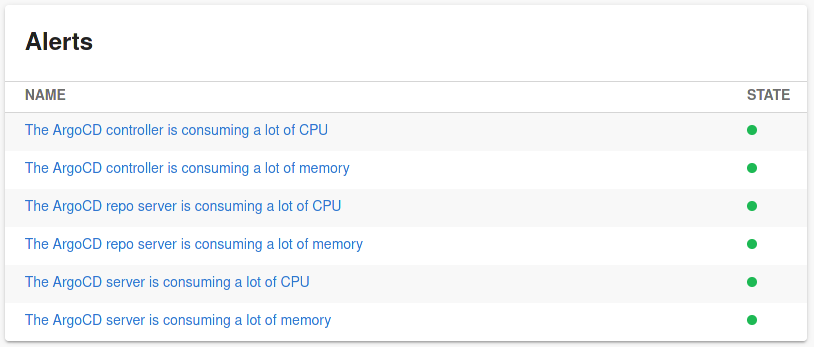
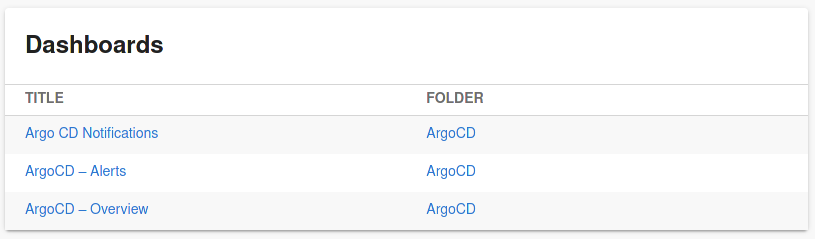
This plugin exports three UI cards that you can show on the Overview tab of a service or any other layout page. Go to Admin > Layout, select Service in the dropdown menu, and then add the following in the Overview section:
- component: EntityGrafanaDashboardsCard
  specs:
    gridProps:
      md: 6
- component: EntityGrafanaAlertsCard
  specs:
    gridProps:
      md: 6
- component: EntityOverviewDashboardViewer
  specs:
    gridProps:
      md: 6
Annotations
To configure the plugin for a service in the software catalog, set the following annotations in its catalog-info.yaml definition file.
The following selector will return dashboards under the folder folder-id and folder-name
metadata:
  annotations:
    grafana/dashboard-selector: "folderUrl == 'https://<grafana-url>/dashboards/f/<folder-id>/<folder-name>'"
Supported variables:
title: title of the dashboardtags: array of tags defined by the dashboardurl: URL of the dashboardfolderTitle: title of the folder in which the dashboard is definedfolderUrl: URL of the folder in which the dashboard is defined
Supported binary operators:
||: logical or&&: logical and==: equality (=== operator in JavaScript)!=: inequality (!== operator in JavaScript)@>: inclusion (left.includes(right) in JavaScript)
Supported unary operators:
!: logical negation
Annotation to embed the overview dashboard referenced by its URL
metadata:
  annotations:
    grafana/overview-dashboard: 'http://grafana/d/qSfS51a4z/some-dashboard?orgId=1&kiosk'
If Grafana's Unified Alerting is enabled, alerts are selected by a label defined on them:
metadata:
  annotations:
    grafana/alert-label-selector: "service=awesome-service"
If Grafana's Unified Alerting is NOT enabled, alerts are selected by a tag present on the dashboards defining them.
metadata:
  annotations:
    grafana/tag-selector: "my-tag"
The aforementioned annotations are suitable for displaying dashboards on a component page, you can as well display alerts on a component page and embed dashboards on a page.
Support
The plugin is owned by K-Phoen and managed in the K-Phoen's Plugin repository as an open-source project. Create a GitHub issue to report bugs or suggest new features for the plugin.